在 PostgreSQL 中,使用 EXPLAIN ANALYZE 不仅能够打印查询优化模块的估算代价,同时也会打印出语句执行时的实际代价,当我们遇到一个 Slow Query 时,就可以使用 EXPLAIN ANALYZE 对结果进行分析。但是 Greenplum 是一个分布式数据库,每一个节点的执行时间以及处理的 tuple 数量都可能不同,那么此时 EXPLAIN ANALYZ 的结果到底表示什么?
1. Greenplum 中的 EXPLAIN ANALYZE
首先,Greenplum 对 EXPLAIN ANALYZE 的结果进行了拓展,除了打印常规的执行时间以及处理的 tuple 数量,还会额外打印出各个 Slice 的执行信息,以及在执行阶段之初预分配给该查询的内存信息。
postgres=# create table t (a int, b int);
postgres=# insert into t select random() * 1000, random() * 1000 from generate_series(1, 1000000);

postgres=# explain (costs off, analyze) select * from t where a > 500 order by a;
                                                     QUERY PLAN
--------------------------------------------------------------------------------------------------------------------
 Gather Motion 3:1  (slice1; segments: 3) (actual time=135.091..360.139 rows=498802 loops=1)
   Merge Key: a
   ->  Sort (actual time=134.412..173.091 rows=177922 loops=1)
         Sort Key: a
         Sort Method:  quicksort  Memory: 91424kB
         ->  Seq Scan on t (actual time=0.035..70.378 rows=177922 loops=1)
               Filter: (a > 500)
               Rows Removed by Filter: 162816
 Planning Time: 0.270 ms
   (slice0)    Executor memory: 67K bytes.
   (slice1)    Executor memory: 11341K bytes avg x 3 workers, 11706K bytes max (seg2).  Work_mem: 11706K bytes max.
 Memory used:  129024kB
 Optimizer: Postgres query optimizer
 Execution Time: 381.492 ms
(14 rows)
由于查询比较简单,只需要各个节点将数据排好序以后再发送给 QD,QD 接收数据进行堆排序即可,因此整个查询计划中只有一个 Gather Motion,即 2 个 Slice。
这里对输出结果做一个简单的解释,大部分的输出结果是和 PostgreSQL 保持一致的:
actual time: actual time 表示当前执行节点的实际执行情况,其表现形式为 start…total。其中 start 表示该节点的实际启动时间,也就是当前节点向上层节点返回第一条 tuple 的准备时间,total 则是该节点的执行总时间,单位均为毫秒。
以上述结果为例,Seq Scan 的实际启动时间为 0.035ms,而 Sort 的实际启动时间为 134ms,其原因在于排序节点必须将数据完全排好序以后才能够向上输出 tuple,因此属于启动代价较高的节点,Seq Scan 则属于启动代价较低的节点。
rows: 当前节点总计向上层节点返回的 tuple 数量,而不是当前节点实际处理的 tuple 数量。以 Seq Scan 节点为例,过滤条件一共过滤了 162816 条数据,向 Sort 节点返回了 177922 条数据,即 Seq Scan 节点一共扫描了 162816 + 177922 = 340738 条数据。结合 actual time 来看,Seq Scan 节点处理 340738 条数据一共耗时 70ms。
loops: loops 表示当前节点的执行次数,比如在 Nested Loop 中,内表可能会被扫描多次,那么此时 loops 就表示实际的扫描次数,同时 actual time 和 rows 的输出结果为每一次执行的平均值。
postgres=# explain (costs off, analyze) select *
from foo, bar where foo.a = bar.a and foo.a < 50;

                                        QUERY PLAN
------------------------------------------------------------------------------------------
 Gather Motion 3:1  (slice1; segments: 3) (actual time=1.472..5.065 rows=4830 loops=1)
   ->  Nested Loop (actual time=0.240..3.381 rows=1927 loops=1)
         ->  Bitmap Heap Scan on bar (actual time=0.220..0.518 rows=187 loops=1)
               Recheck Cond: (a < 50)
               ->  Bitmap Index Scan on bar_a (actual time=0.190..0.190 rows=187 loops=1)
                     Index Cond: (a < 50)
         ->  Index Scan using foo_a on foo (actual time=0.000..0.011 rows=10 loops=187)
               Index Cond: ((a = bar.a) AND (a < 50))
 Planning Time: 1.333 ms
   (slice0)    Executor memory: 80K bytes.
   (slice1)    Executor memory: 2408K bytes avg x 3 workers, 2408K bytes max (seg0).
 Memory used:  129024kB
 Optimizer: Postgres query optimizer
 Execution Time: 6.288 ms
如上所示,对于内表 foo 的扫描使用了索引扫描,总计扫描了 187 次,actual time 中的 total 为 0.011ms,这显然不是该节点的总执行时间,而是平均执行时间,即该节点一共执行了 0.011 * 187 = 2.057ms。
Buckets && Batches: TODO
Slice information: TODO
Memory used: Memory used 表示在 Greenplum 的内存资源管理下,为该查询预先分配的内存数量,由函数 ResourceManagerGetQueryMemoryLimit() 完成,并不表示实际的内存使用。
同时一个 Query 的内存使用可能也不受该字段的约束。如下所示,尽管系统预分配了 129024kB 给该查询,但实际的排序节点却使用了 182846kB 的内存。同时该字段的名称很容易导致歧义,可以考虑在后续版本修改该字段名,例如 Planned Query Memory。
postgres=# explain (costs off, analyze) select * from t where a > 500 order by a;
                                      QUERY PLAN
-----------------------------------------------------------------------------------------------
 Gather Motion 3:1  (slice1; segments: 3) (actual time=278.764..707.422 rows=997604 loops=1)
   Merge Key: a
   ->  Sort (actual time=278.024..360.312 rows=355844 loops=1)
         Sort Key: a
         Sort Method:  quicksort  Memory: 182846kB
         ->  Seq Scan on t (actual time=0.037..140.474 rows=355844 loops=1)
               Filter: (a > 500)
               Rows Removed by Filter: 325632
 Memory used:  129024kB
 Optimizer: Postgres query optimizer
 Execution Time: 747.208 ms
2. EXPLAIN ANALYZE 的实现
在我阅读 EXPLAIN ANALYZE 的实现时,给我的感觉就是下面这张图:

“缝合怪”,我觉得这是一个形容 EXPLAIN ANALYZE 结果的最佳词语。其原因在于 EXPLAIN ANALYZE 结果中的每一个执行节点(例如 Hash Join、Sort、Seq Scan、Index Scan) 都来自所有 segments 执行结果中 tuple 数量最多的结果节点,听起来有点儿绕,如下图所示:
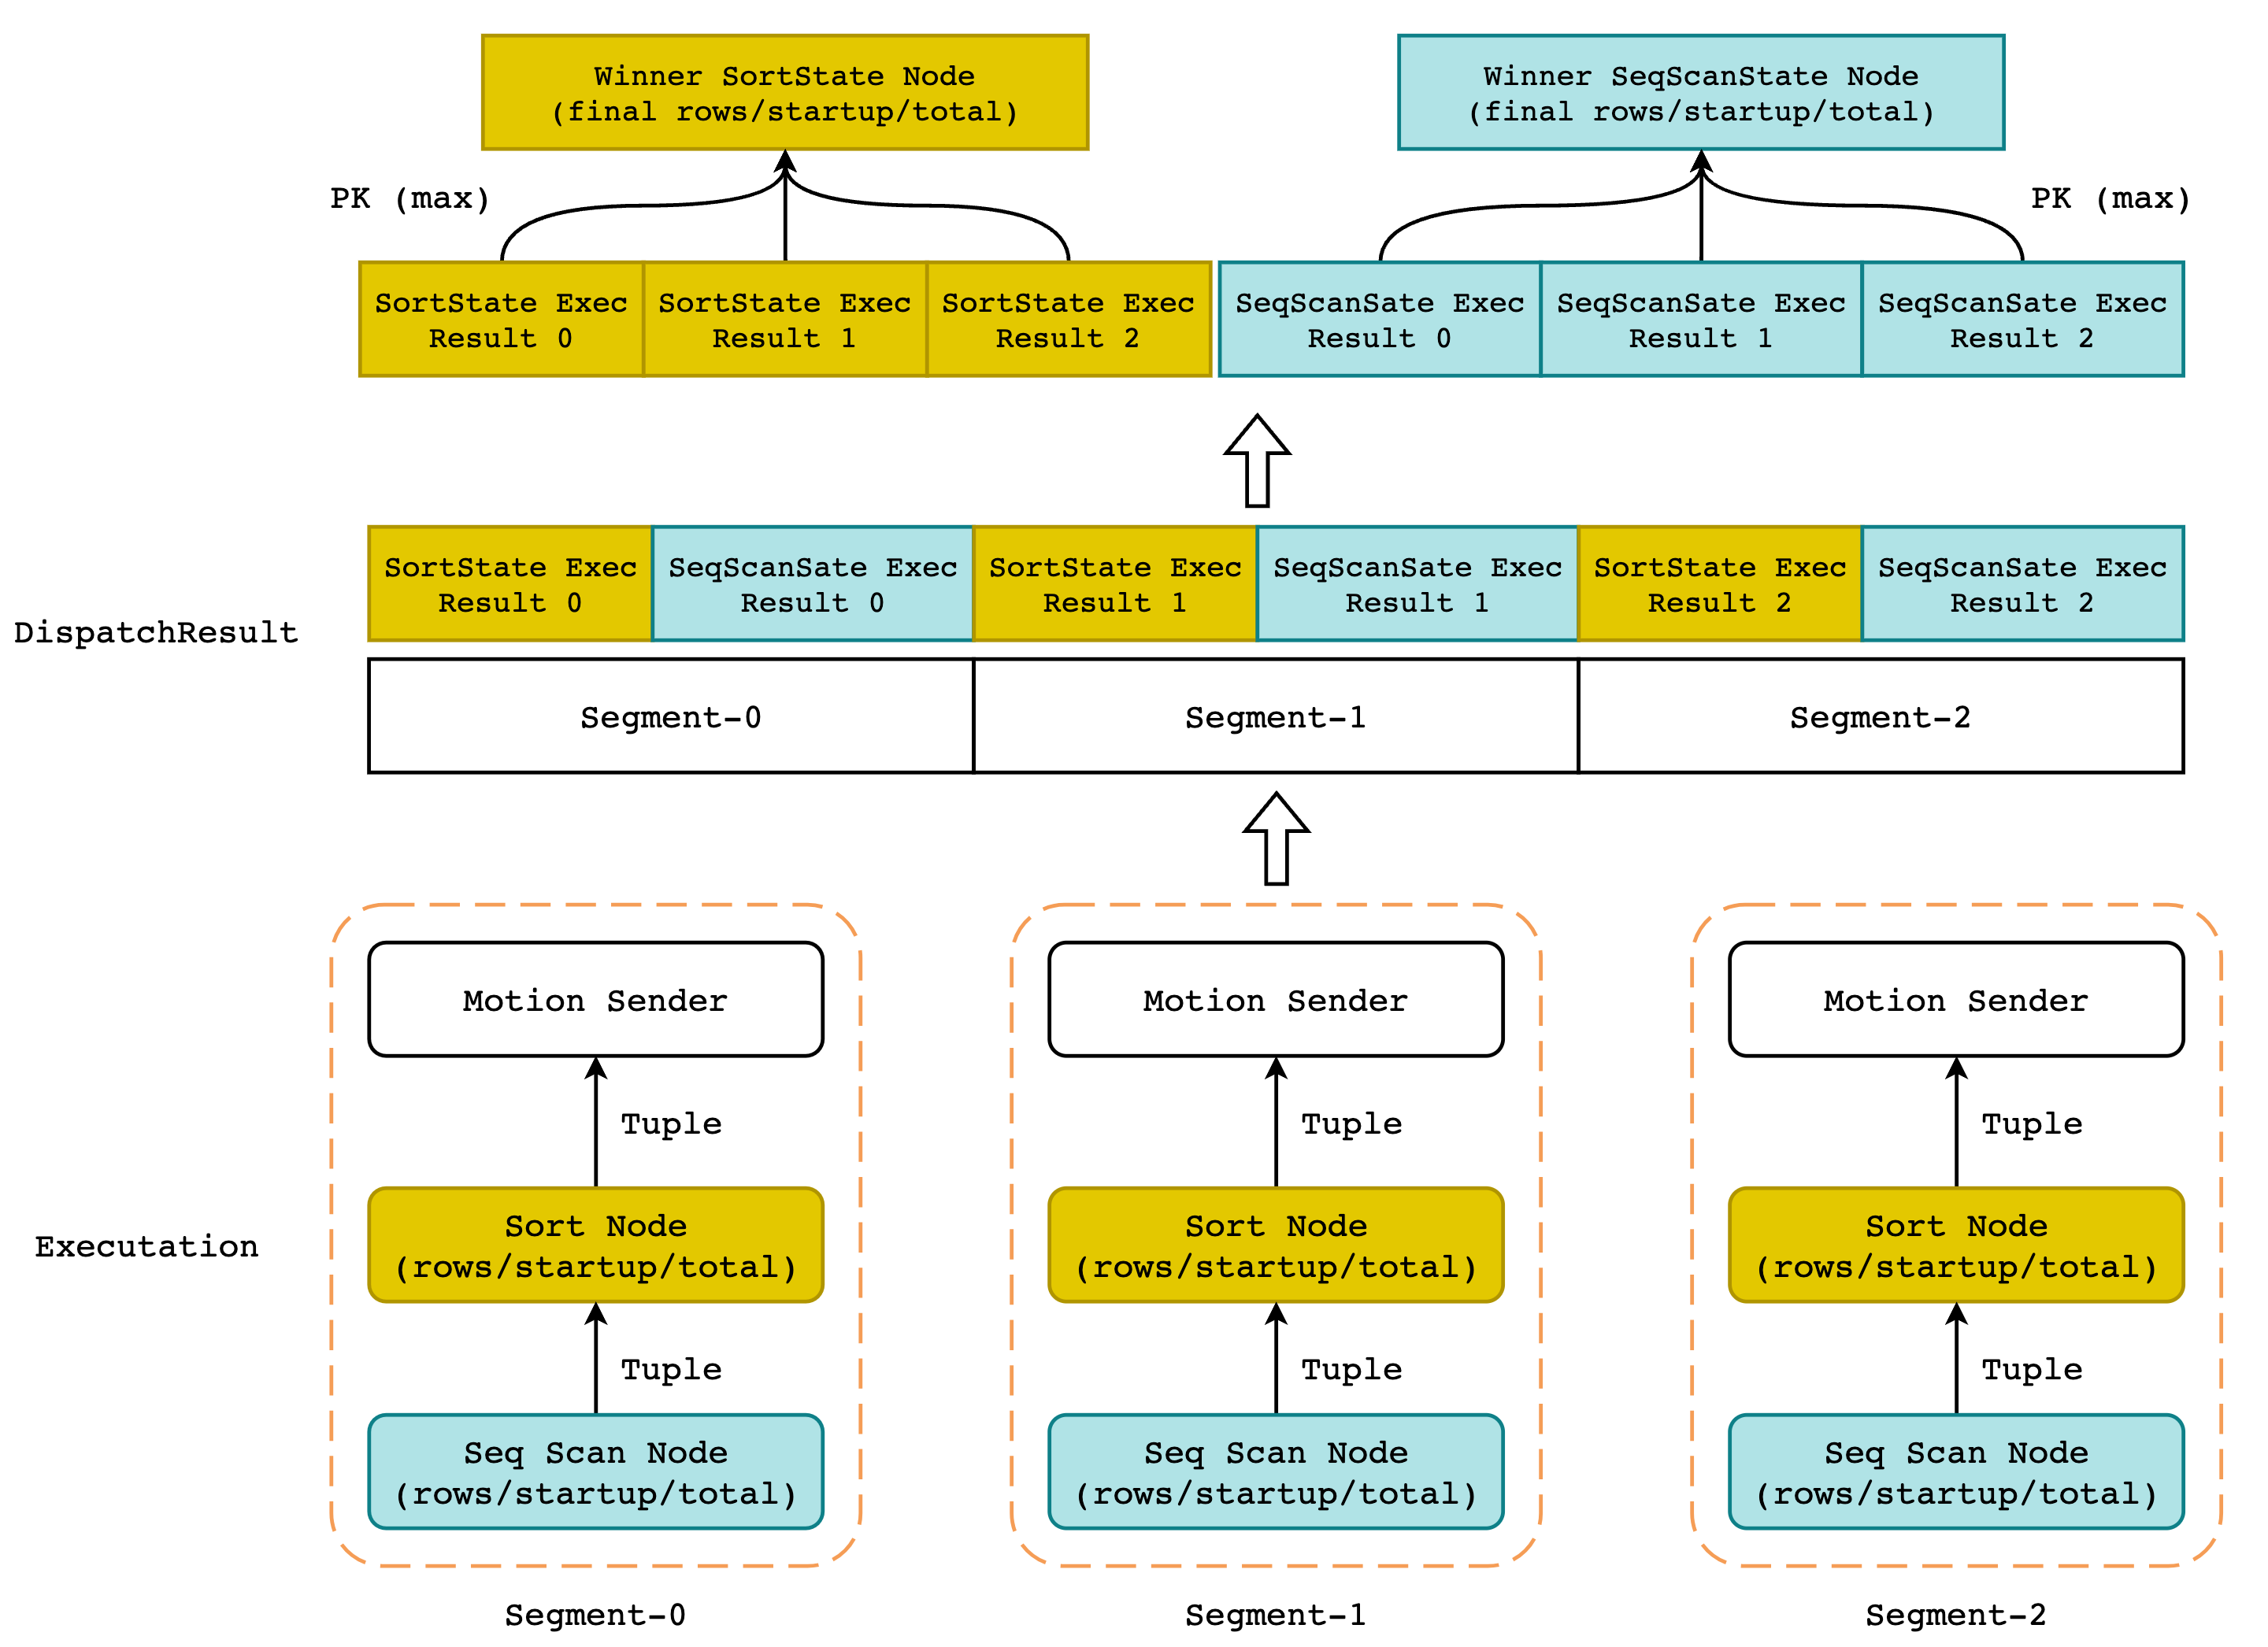
正如同火山模型一样,我们从下往上看这幅图示:
首先,QD 会将执行计划发送(Dispatch)给 QE 进行执行,并等待 Dispatch 结果。这里的 Dispatch Result 并不是一条一条的 tuple,而是各个 segment 对 EXPLAIN ANALYZE 的执行结果,执行树将会以前序遍历的方式被保存在一个数组中。
如上图所示,由于 Greenpulm 集群中一共有 3 个节点,因此 DispatchResult 的数组长度为 3,数组中的元素即保存了每个 segment 的每个执行节点的实际运行数据。例如 DispatchResult[0][0] 就保存了 segment-0 对 Sort Node 的执行结果,包括 actual time、sort method、rows 等信息。DispatchResult[1][1] 则保存了 segment-1 对 Seq Scan Node 的执行结果。
而后对 DispatchResult 进行遍历,挑出所有执行结果中相同节点的执行结果进行比较,并将 rows 最大的节点 (也就是输出 tuple 最多的节点) 作为结果节点保存。当我们遍历完所有的节点,找出所有 rows 最大的节点以后,即可拼装出最终的结果。
因此,Greenplum 并没有对所有 segment 的执行结果取平均值或者取百分位数这样的操作,而是直接使用的 MAX 操作。
对于具体的代码实现,可见下图的调用栈,核心函数即为 cdbexplain_depositStatsToNode()。
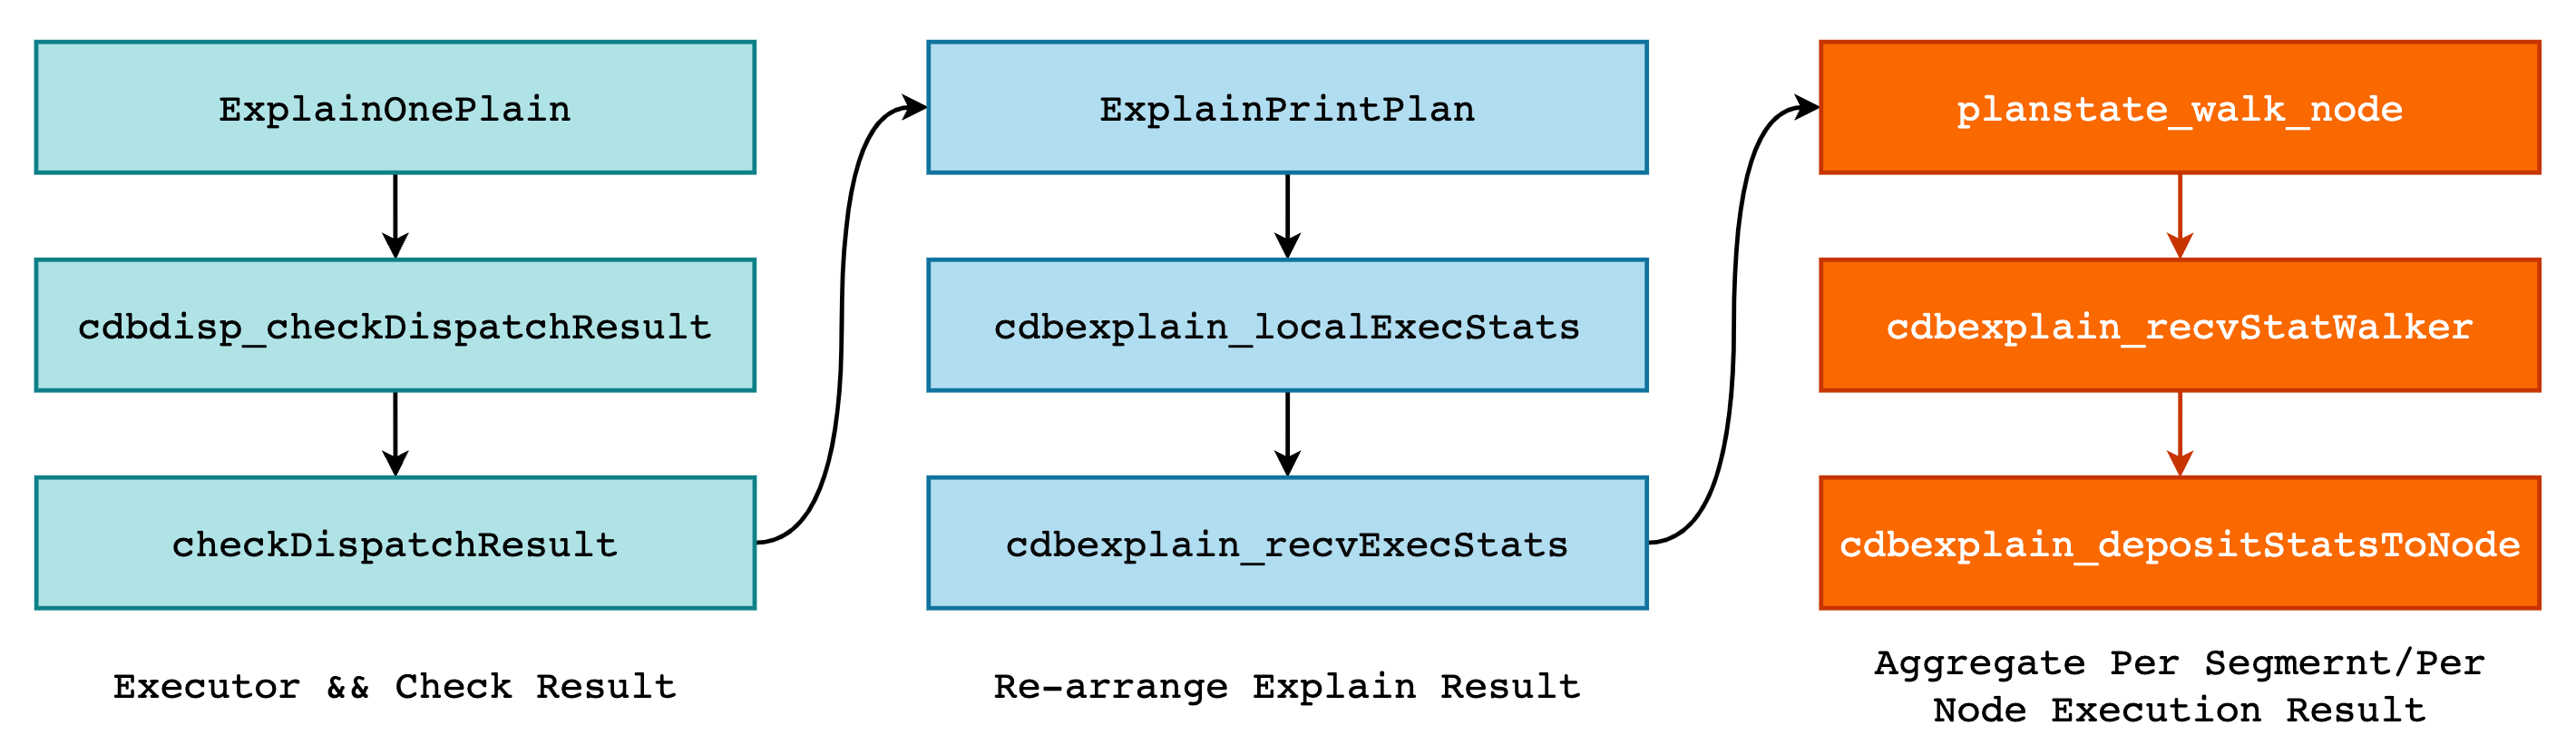
在该函数中,主要工作就是对各个 Segment 的执行结果进行整理,得到数据的总值、平均值以及最大值等统计信息。这些信息全部保存在 CdbExplain_DepStatAcc 结构体中:
typedef struct
{
	double		vmax;			/* 统计数据的最大值 */
	double		vsum;			/* 统计数据的和 */
	int			vcnt;			/* 统计数据的个数,和 vsum 可计算平均值 */
	int			imax;			/* 拥有最大值的 segment index */
} CdbExplain_Agg;

typedef struct CdbExplain_DepStatAcc
{
	CdbExplain_Agg agg;                /* 数据统计信息 */

	CdbExplain_StatHdr  *rshmax;       /* 最大值所在的原始 QD 结果数组 */
	CdbExplain_StatInst *rsimax;       /* 指向 rshmax 中具体的 nstrumentation 对象*/
	CdbExplain_StatInst *nsimax;       /* 指向 node summary 中具体的 instr 对象*/

	double		max_total;                /* 执行当前节点的最长总时间 */
	instr_time	firststart_of_max_total;  /* 与 max_total 对应的实际启动时间 */
} CdbExplain_DepStatAcc;
以 ntuples 为例,在遍历 Diapatch Results 数组时更新对应的 CdbExplain_Agg 和其它字段即可:
CdbExplain_DepStatAcc ntuples;
cdbexplain_depStatAcc_init0(&ntuples);

for (imsgptr = 0; imsgptr < ctx->nmsgptr; imsgptr++)
{
    rsh = ctx->msgptrs[imsgptr];        /* 获取第 imsgptr 个 QE 的执行结果 */
    rsi = &rsh->inst[ctx->iStatInst];   /* 获取具体的 node 结果 */

    nsi = &ns->insts[rsh->segindex - ns->segindex0];
    *nsi = *rsi;

    /* 在该函数中使用 rsi 中的信息更新统计信息 */
    cdbexplain_depStatAcc_upd(&ntuples, rsi->ntuples, rsh, rsi, nsi);
}
而 cdbexplain_depStatAcc_upd() 的实现也非常简单:
static inline bool cdbexplain_agg_upd(CdbExplain_Agg *agg, double v, int id)
{
    if (v > 0)
    {
        agg->vsum += v;     /* 更新累加值 */
        agg->vcnt++;        /* 更新计数器 */

        if (v > agg->vmax || agg->vcnt == 0)
        {
            agg->vmax = v;  /* 更新最大值以及最大值对应的 index */
            agg->imax = id;
            return true;
        }
    }
    return false;
}

static inline void
cdbexplain_depStatAcc_upd(CdbExplain_DepStatAcc *acc,
						  double v,
						  CdbExplain_StatHdr *rsh,
						  CdbExplain_StatInst *rsi,
						  CdbExplain_StatInst *nsi)
{
	if (cdbexplain_agg_upd(&acc->agg, v, rsh->segindex))
	{
		acc->rshmax = rsh;
		acc->rsimax = rsi;
		acc->nsimax = nsi;
	}

    /* 更新 total 以及 firststart_of_max_total */
	if (acc->max_total < nsi->total)
	{
		acc->max_total = nsi->total;
		INSTR_TIME_ASSIGN(acc->firststart_of_max_total, nsi->firststart);
	}
}
那么当遍历结束后,acc->nsimax 中就保存了所有 PK 结果中“胜者”,其中的 total,rows 以及 loops 等将会作为 EXPLAIN ANALYZE 的结果进行输出。
Greenplum 为了防止 Filter 节点将所有的元组都过滤掉,使得所有 segment 的 rows 等于 0,从而导致 actual time 中的 start 和 total 为 0 的情况出现,Greenplum 将会在此时将 start 和 total 替换成最长的执行时间,而不是返回 tuple 数量最多的节点的执行时间。
此外,对于 Sort 等特殊节点,Greenplum 会额外打印出其使用的内存空间或者是磁盘空间,该结果和 Sort 节点并不一定是一一对应的,即返回 tuple 数量最多的 Sort 节点不一定是消耗内存最多的节点(例如对 varchar 的排序),而 EXPLAIN ANALYZE 对内存的输出同样取 MAX 值。
因此,回到正题,之所以称 Greenplum EXPLAIN ANALYZE 的结果是“缝合怪”的原因就在于其结果是所有 Segments 执行结果的拼凑,就好像“东市买骏马,西市买鞍鞯,南市买辔头,北市买长鞭”,得挑最好的。